Definitions: daily turnover ("24h volume") is the total volume of executed trades over 24 hours. Depth near the price is the volume of limit orders in the order book within a 1-2% window around the current price.
Spread is the difference between the best bid and the best ask. Slippage is the difference between the expected price and the average price of actual execution for a market order of a given size.
Why can daily volume be misleading? Cross trades, rebate programs (a partial fee refund) and points campaigns can raise daily turnover without increasing depth near the price and without making exits cheaper.
Terms: wash trading, fake volume, points and the liquidity mirage
Wash Trading means offsetting trades between one participant or related accounts that do not change the Net Position. Daily turnover rises because every trade is counted as volume.
Fake Volume is turnover without independent counterparties, created by series of offsetting trades or by incentives such as "reward for volume".
- Reported Volume is the turnover figure shown in a platform interface or API.
- Real Volume (volume with market support) is turnover accompanied by stable order-book depth near the price and confirmed by cross-exchange arbitrage.
- Liquidity Mirage is a market with high reported turnover where a medium-size market order creates high impact because depth near the price is weak.
Impact (price impact) is the deterioration of the average execution price caused when a market order consumes order-book levels.
Points are credits awarded for trades, fees or actions inside a protocol. A formula such as "more turnover -> more rewards" creates back-and-forth trade series with minimal net position.
Point-farming mechanism: a formula where the reward is proportional to turnover makes offsetting trade cycles profitable, rather than holding a market position; after the campaign ends, the incentive to maintain turnover disappears.
Order Book is the list of limit orders near the price that are available for execution. Liquidity for a trade is described through depth near the price, spread and slippage on a market order of a given size.
The article "Why the crypto market falls differently from the stock market" shows how order-book levels relate to price pauses during impulses.
This section's glossary is needed for one check: high reported turnover is not the same as a cheap exit if the order book near the price cannot absorb a market order.
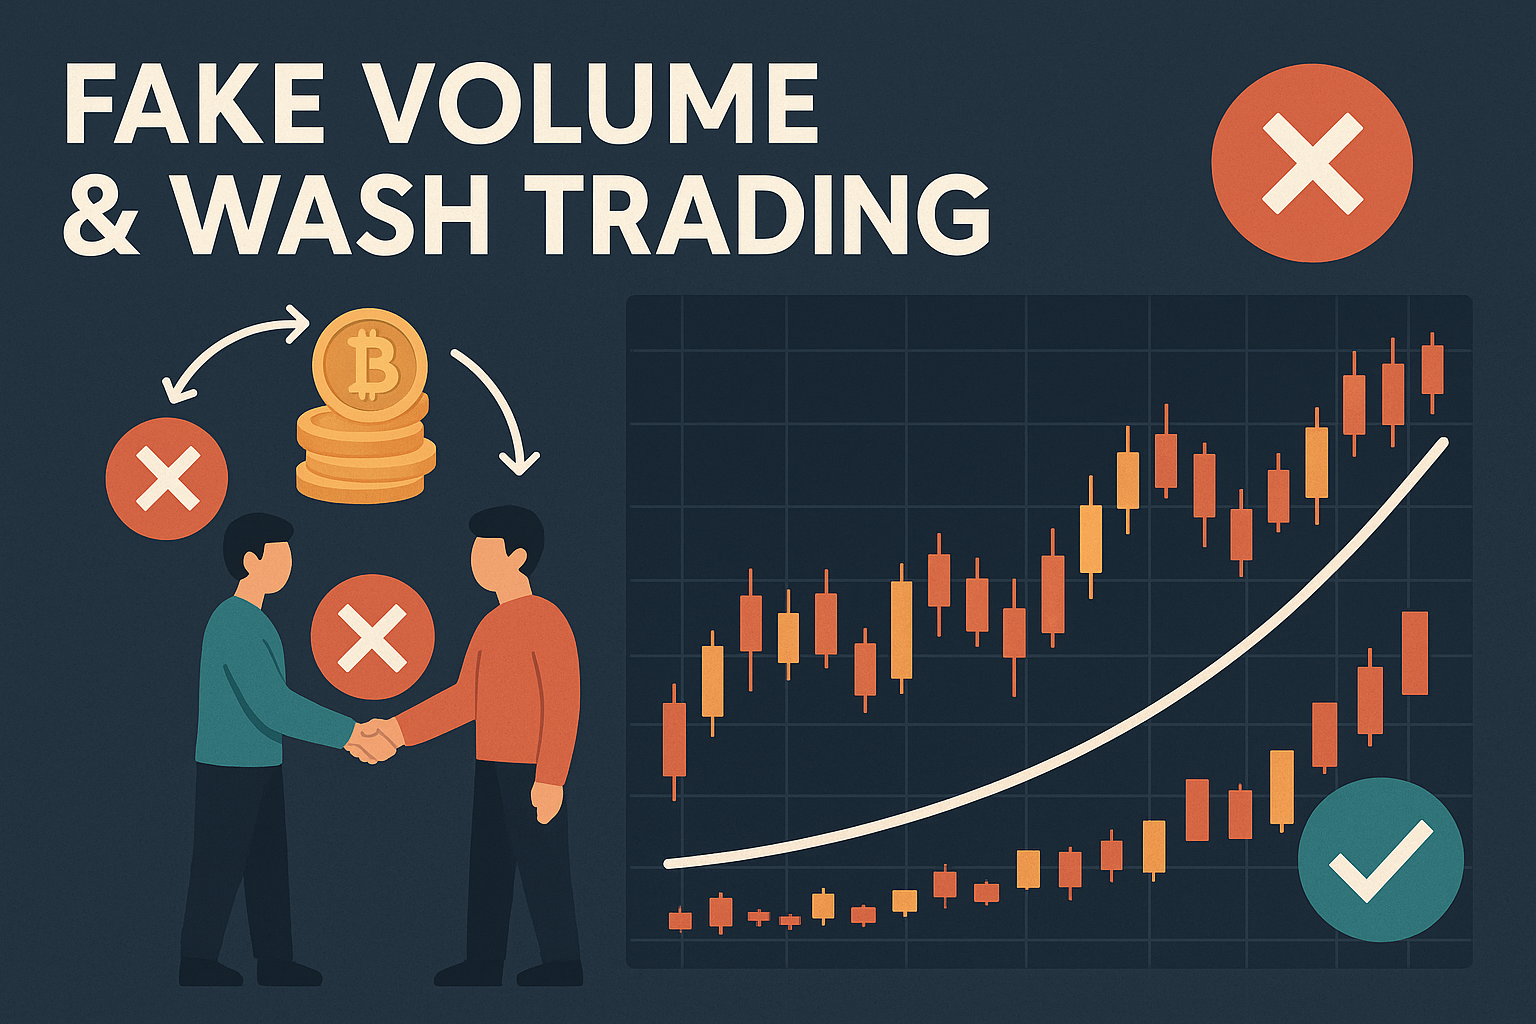
Daily turnover can rise without liquidity: the exit price is determined by order-book depth and slippage on a market order.
Why "large volume" often does not mean liquidity
A thin order book shows up through impact: a market order of fixed size worsens the average price more than in a market with stable depth near the price, even when reported turnover is high.
Reported turnover stops being a proxy for liquidity when volume is generated by offsetting trades or fee incentives. In that trading, the tape is active, but the number of independent participants is not growing.
Liquidity for a trade is revealed when the position is closed: a market order widens the spread and walks to farther book levels when there are not enough orders near the price.
Example: a pair shows high daily turnover, but a medium-size market order "eats" several book levels and worsens the average execution price on every subsequent order.
Rebate and points campaigns increase turnover by the rule "more turnover -> more rewards", so volume can fall sharply after the incentive program ends.
Liquidity is defined by execution cost: order volume near the price, spread width and slippage on a market order of a given size show how much it costs to enter and exit a position.
Volume != money: why turnover is not capital inflow
Trading Volume shows the sum of trades, not the inflow of new capital. One deposit can create large turnover through offsetting cycles without increasing independent demand.
- Turnover is the sum of trades, including repeated "buy-sell" cycles.
- Net Flow is the change in participants' net positions that shifts the balance of supply and demand.
- Execution Quality is spread and slippage for an order of fixed size.
- Market Depth is the volume of orders near the price that remains available as the price approaches a level.
Example: capital of $200,000 makes dozens of "buy-sell" cycles in a narrow range; turnover grows, but order depth near the price and the number of independent buyers do not increase.
Mechanical split: churning increases turnover without increasing depth near the price and without sustainably narrowing the spread; capital inflow is more often accompanied by more depth near the price and lower slippage on a comparable order size.
Comparing turnover with depth near the price shows what share of "activity" turns into executable volume close to the price.
How the "set" is built: schemes for inflating volume and depth
Turnover inflation is created by series of offsetting trades, when related accounts take turns buying and selling the same volume to each other at a close price. "Drawn" depth is created by limit orders that are removed before execution.
Interpretation limit: a volume spike can be natural during a listing, news event or arbitrage; manipulation is confirmed by a combination of repeated prints, a high cancellation share at the best levels and high impact on a small market order.
Wash Trading: "two hands" and zero economics
Related accounts make offsetting trades; turnover grows even if the Net Position at the end of the trade series stays the same.
- Turnover grows without Net Flow growth.
- The spread does not narrow in proportion to turnover.
- A market order walks to farther book levels.
- Prints repeat by size and timing.
The combination "high turnover + high impact" means there is a shortage of orders near the price for executing a market order of a given size.
Point Farming: turnover as a derivative of the reward formula
Points are awarded for turnover or fees; the goal of trade cycles is rewards, not holding a market position.
- Turnover grows because of repeated cycles.
- Depth near the price does not grow in proportion to turnover.
- After the campaign ends, turnover falls faster than market activity.
Turnover in a points campaign measures the sum of trade cycles, not the number of independent buyers and sellers.
Fake Depth: decorative order-book density
Spoofing and layering mean placing large limit orders and then cancelling them to create the appearance of depth near the price.
- Large "walls" disappear when the price approaches them.
- The cancellation share at the best levels is higher than the execution share.
- Slippage jumps on a medium-size market order.
Decorative depth reveals itself at the moment a level is touched: orders are removed, and the next available level becomes worse.
Derivatives: high turnover, thin book
Futures turnover can rise because of overtrading and scalping; with a thin book, leverage amplifies wicks and accelerates liquidation cascades.
- Order-book gaps create extreme prints on small trade volume.
- Leverage accelerates stop triggers and liquidations.
- Turnover growth does not guarantee lower slippage on exit.
The combination "thin book + leverage" increases wick amplitude even when trade turnover is high.
Impact logic and mark prices are explained in the Lighter DEXreview.
Checking for a liquidity mirage comes down to comparing slippage on a market order of a given size with the volume of orders near the price.
Market making and wash trading: where the boundary lies
Market Making is placing two-sided limit quotes that keep the spread narrow and support order depth near the price. Wash Trading is offsetting trades between related accounts that inflate turnover without improving execution.
| Signal | Market making | Wash trading |
|---|---|---|
| Goal | Support quotes and narrow the spread | Increase turnover and tape activity |
| Counterparties | Independent participants | Related accounts or addresses |
| Order-book reaction to load | Orders remain available when levels are touched | Orders are removed as price approaches |
| Print pattern | Irregular sizes and timing | Repeated series and "buy-sell" symmetry |
Market making shows up as a narrower spread and lower slippage on the same market-order size; manipulation shows up as turnover growth while exit cost stays unchanged.
- Turnover grows while the spread remains wide.
- Identical prints appear in series with "buy-sell" symmetry.
- The best book levels disappear when touched.
Example: quotes exist on both sides, but a medium-size market order walks through several book levels and produces high slippage when the test is repeated.
The boundary is set by an execution test: the same market-order size gives low slippage in a market with stable quotes and high slippage in a market with decorative orders.
Where the "liquidity showcase" is built most often
Decorative turnover is more common in new pairs, thin markets and points campaigns, where high turnover is used as a showcase in listings and aggregators.
TVL (Total Value Locked) is the value of assets deposited in a DEX pool; low TVL limits the trade size that can be executed without large slippage.
Zones with elevated turnover inflation risk:
- Low-liquidity pairs where one participant can create a significant share of turnover through offsetting trades.
- DEX pools with low TVL, where a medium-size swap creates high slippage.
- Platforms with rebate programs, where fee refunds encourage trade cycles.
- Points and airdrop campaigns where rewards depend on turnover or fees.
Depth near the price grows only when limit orders remain in the book as levels are touched; offsetting trades and orders cancelled on touch increase turnover without increasing executable depth.
High reported turnover with a thin order book means an expensive exit even if the trade tape looks active.
Diagnosing a market suspected of being a showcase relies on the order book, spread and slippage for a comparable market-order size.
Diagnostics: how to distinguish liquidity from decoration in 10 minutes
Diagnostics uses four sources: the order book, the trade tape, the price chart and a fixed-size market order; the goal is to connect reported turnover with execution cost.
-
Comparing volume and price behavior
- Offsetting trades inside a narrow range increase turnover without moving the price.
- High turnover with flat price action does not confirm Net Flow.
- Sharp candles on small prints point to gaps in the book.
-
Order-book and spread analysis
- Depth near the price estimates the volume of orders available for execution close to the price.
- A wide spread with high turnover means weak quotes near the price.
- A high cancellation share at the best levels reduces the executability of orders.
-
Trade tape analysis
- Repeated print sizes and even timing point to automated trade series.
- Symmetric "buy-sell" series are consistent with offsetting cycles.
- Splitting prints into identical "packs" creates the appearance of even demand.
-
Market-order execution test
- A market order of a given size records slippage as the cost of immediate exit.
- A move to farther book levels increases impact and worsens the average price.
- Removal of the best levels when touched points to non-executable "depth".
-
Checking turnover incentives
- A points campaign that pays for turnover increases offsetting cycles.
- A rebate program lowers the cost of fees and encourages overtrading.
- The end of incentives often coincides with lower turnover while price remains stable.
Signs of rug pull risk in a DEX pool: LP tokens are liquidity-provider share tokens that allow assets to be withdrawn from the pool.
- One address holds most LP tokens and can remove liquidity in one transaction.
- Volume/TVL is high, while exit slippage is already high on a small swap.
- Turnover is created by repeated addresses, and activity falls when those addresses stop.
- Price moves sharply on small swap volumes because the pool is thin.
- The end of a points campaign coincides with a fall in turnover and TVL.
Attack scenarios against DeFi liquidity are collected in the article "DeFi security: threat map, cases and protection".
High slippage on a market order of a given size despite high reported turnover means a mismatch between the turnover showcase and executable depth near the price.
How fake volumes break trading signals and indicators
OBV (On-Balance Volume) and VWAP (Volume Weighted Average Price) use trade turnover as their calculation base; with offsetting trades, where related accounts buy and sell to each other at the same time, indicators receive an inflated input.
- False breakout: turnover is high, but levels do not hold because the order book near the price cannot absorb a market order.
- OBV without Net Flow: turnover grows while participants' net positions barely change.
- VWAP displacement: a series of inflated prints shifts the volume-weighted average price, then price returns to zones of real quotes.
- Fake clusters: identical print sizes create the picture of a "large player" without independent capital.
- Filter failure: a rule such as "enter when volume rises" selects pairs with expensive exits because slippage is high.
Interpretation boundary: growth in reported turnover does not prove demand if depth near the price remains thin and the spread remains wide.
Scenario: price breaks a level on record turnover, but the next market order creates high impact against the position because orders near the price are scarce.
Volume-based indicators are considered only after execution cost is checked through the order book, spread and slippage.
Quality metrics: what to watch instead of "daily turnover"
Execution metrics matter for a trade: they record the entry and exit price for a given order size and cannot be reduced to a single turnover number.
| Metric | What is measured | Showcase signal |
|---|---|---|
| Spread | Difference between the best bid and ask | Wide spread with high turnover |
| Depth near the price | Volume of orders close to the price, for example within a 1-2% window | Low depth despite high turnover |
| Impact / Slippage | Average price deterioration on an order of fixed size | High slippage even on a small order |
| Trade size distribution | Distribution of print sizes | Identical prints in series |
| Order-to-trade ratio | Ratio between orders and executions | Many cancellations and few executions |
| DEX: Volume / TVL | Ratio between turnover and pool liquidity | High Volume/TVL with high slippage |
Interpretation rule: high turnover only becomes meaningful when depth near the price is sufficient and slippage on a comparable order size remains low.
For futures, an extra link with OI is useful: Open Interest (OI) is the sum of open positions; high turnover with almost unchanged OI is consistent with overtrading without growth in obligations.
The relationship between volume, funding rate and open interest is covered in the article about funding rate and open interest.
The combination of spread, depth near the price and slippage answers the practical trade question: how much it costs to enter and exit with a given size.
Why decorative liquidity is more dangerous in derivatives
Perpetual Futures, or perpetual swaps, amplify the consequences of a thin order book through leverage: lack of orders near the price creates a wick, the wick triggers stops, stops accelerate the move and launch liquidations.
- Liquidation Cascade: a move knocks out margin and creates forced closures.
- Wick Risk: gaps in the order book create extreme prints on small trade volumes.
- Mark / Index Sensitivity: mark prices smooth ticks, but they do not add orders to the book near the price.
- Funding Distortion: high overtrading changes funding while OI dynamics remain weak.
Interpretation limit: futures turnover does not compensate for a thin book; risk increases when slippage on a market order of a given size remains high while depth near the price is weak.
The combination "thin book + leverage" turns a small impulse into a liquidation series, because closing market orders walk through the book and amplify impact.
"Safe order size" is the volume of a market order that executes without meaningful deterioration of the average price; comparing this value across platforms shows the difference in execution quality.
High derivatives turnover does not reduce wick and liquidation cascade risk if the order book near the price remains thin.
Cases: what fake volumes look like in practice
Cases of volume inflation share one signal: turnover grows faster than execution improves, and the divergence is visible through spread and slippage on a comparable market-order size.
Coinbit: high turnover with weak depth near the price
The Coinbit case is described through the gap between reported turnover and execution: a market order quickly worsens the average price because orders near the price are scarce.
- Turnover is used as an argument for "liquidity".
- A market order widens the spread and produces high slippage.
- Repeated prints are consistent with trade cycles.
- Executable depth near the price does not match the turnover showcase.
The combination "high turnover + high slippage" means there is no liquidity for a trade of the given order size.
Gotbit: metric growth without lower exit cost
The Gotbit case describes turnover growth without improved trading conditions; the divergence signal is the absence of sustained spread narrowing and weak dynamics in order depth near the price.
- Turnover grows faster than depth near the price.
- The spread does not narrow in proportion to turnover.
- The trade tape shows repeated series and identical sizes.
- Orders near the price disappear when a market order arrives.
Turnover growth without lower slippage means turnover is being used as a reporting metric, not as a sign of executable liquidity.
DEX bots: turnover created by repeated addresses
In small DEX pools, the same set of addresses can make offsetting swaps; turnover grows, while TVL and execution quality do not improve proportionally.
- Volume/TVL is high because of swap cycles inside the pool.
- Repeated addresses dominate the swap history.
- Exit slippage remains high even at medium size.
- Turnover falls when activity incentives decline.
On-chain turnover without TVL growth and without lower slippage does not mean pool liquidity for a trade.
Points and wash patterns: turnover as a way to mine rewards
A reward formula based on turnover creates trade cycles with minimal net position, so turnover growth is not accompanied by growth in independent demand.
- Identical prints repeat in series.
- Turnover grows without sustained growth in depth near the price.
- Turnover falls after the reward campaign ends.
- Exit slippage remains high.
In a points campaign, turnover reflects the sum of cycles, while spread and slippage reflect the market quality for a trade.
Checking a case comes down to one comparison: slippage on a fixed-size market order is compared with order depth near the price and with the structure of the trade tape.
Choice practice: where turnover is more often honest and where it is decorative
Large CEX pairs: where depth is more often supported by the market
On key pairs of large CEXs, depth near the price is more often supported by independent orders and cross-exchange arbitrage; quality is still checked by execution, not by the turnover showcase.
- A thin book near the price creates high slippage even with high turnover.
- Arbitrage reduces price divergence between platforms.
- Turnover on one exchange without activity on others weakens trust in the volume.
- Showcase signal: high turnover with a wide spread and high cancellation share.
Even on large CEXs, reported turnover is interpreted through spread and slippage on a comparable market-order size.
The mechanics of cross-exchange arbitrage are explained in the article about cross-exchange arbitrage.
DEX pools and points seasons: where turnover is inflated by cycles
Small DEX pools are easier to churn through offsetting swaps; points and airdrop incentives add turnover without proportional TVL growth and without better execution.
- High Volume/TVL is consistent with swap cycles inside the pool.
- Repeated addresses in swaps point to a narrow participant set.
- Turnover and TVL can fall after incentives end.
- Exiting is more expensive because of slippage in a thin pool.
For a DEX pool, TVL and swap execution cost matter, not daily turnover in an aggregator.
Interpretation boundary: high Volume/TVL without lower slippage is consistent with turnover churning, because exit cost does not improve as turnover grows.
The difference between markets appears in the exit price: the same order size creates different slippage despite the same turnover showcase.
How platforms and protocols limit wash trading and inflation
Inflated turnover creates a false liquidity signal: the turnover showcase looks high, but exit cost is determined by depth near the price, spread and slippage on a market order of a given size.
-
Filtering self-trading and related entities
- Self-trade prevention blocks trades between related accounts and addresses.
- Behavioral and network links reveal groups of accounts with synchronized cycles.
- Turnover from related entities is excluded from calculations or down-weighted.
-
Controlling trade structure and rhythm
- Trade surveillance looks for repeated series, identical sizes and "buy-sell" symmetry.
- Anomalous timing and size patterns are added to risk flags.
- Series of offsetting trades are marked as suspicious.
-
Limiting incentivized turnover
- Rewards are reduced for offsetting trades and repeated cycles.
- Trade-frequency limits reduce the value of overtrading for rewards.
- Rewards shift toward quote and execution metrics, not turnover.
-
Accounting for market breadth
- Metrics account for the number of unique participants and the distribution of counterparties.
- Turnover created by a narrow group of accounts receives lower weight.
- Turnover without participant distribution is not used as a liquidity signal.
-
Reducing rebate-cycle motivation
- Rebate mechanics are limited so they do not subsidize offsetting cycles.
- Fee subsidies are moved into conditions that do not depend on turnover.
- Fee refunds stop covering the cost of overtrading cycles.
Alternative reward principle: rewards are tied to quote presence time and the share of filled limit orders, not to turnover amount.
Anti-fraud filters do not replace execution measurement: exit cost is recorded by slippage on a market order of a given size.
FAQ on fake volumes and wash trading
Is fake volume always connected with fraud?
Most often, yes: fake volume is intentionally created through offsetting trades and does not reflect real demand. However, high turnover by itself does not always mean manipulation; during listings, news events or arbitrage, volume can grow without repeated prints, mass cancellations or high slippage.
Why do points campaigns intensify the illusion of liquidity?
A reward formula based on turnover makes back-and-forth trade cycles profitable, so reported turnover grows without growth in executable depth near the price and without making exits cheaper.
What is the minimum sign of liquidity for a trade?
The minimum sign of liquidity is a combination: sufficient order depth near the price, a narrow spread and low slippage on a market order of a given size.
Why does depth disappear when the price moves?
Spoofing and layering create large limit orders and remove them as the price approaches, so displayed depth does not become execution at the moment the level is touched.
Is a DEX safer than a CEX in terms of fake volumes?
Not necessarily. A DEX provides on-chain swap history, which makes operations easier to verify, but in low-TVL pools, trade cycles between the same addresses can create high turnover without real liquidity. The signal of such churning is high Volume/TVL with high slippage.
What does activity on only one platform mean?
Activity on one platform without a price link to other markets weakens arbitrage support, so the same market-order size can create greater slippage because opposing demand is scarce.
The comparison of CEX and DEX models is covered in "DEX vs CEX: what to choose".
For any pair, the article uses one set of metrics: depth near the price, spread and slippage on a comparable market-order size.
Fake volumes and wash trading: conclusion through execution metrics
Reported turnover is useful only together with order depth near the price, a narrow spread and low slippage on a market order of a given size.
Decorative turnover appears because of offsetting cycles, rebate programs, bots and points campaigns that pay for turnover; in these modes, turnover grows without making exits cheaper.
- Offsetting cycles increase turnover without changing Net Flow.
- Rebates reduce fee cost and make overtrading economically viable.
- Repeated prints in series are consistent with automated cycles.
- A reward formula based on turnover supports volume without independent demand.
A market is liquid for a trade when the order book near the price absorbs a market order of a given size and produces low slippage; a market is a "showcase" when turnover is high while exit cost remains high.
- High turnover with a thin order book means an expensive exit.
- A wide spread means weak quotes near the price.
- Order cancellation when touched means non-executable "depth" at the moment of exit.
Liquidity is measured by execution: slippage on a market order of a given size records exit cost, while turnover without executable depth near the price does not reduce that cost.