Volatility as the basis of a trade: stop, size and realistic expectations
Volatility in crypto is the width of price movement over time. For a trader it is not an abstract market statistic but the main setting for the trade: it defines which stop is normal, which position size is safe and when a strategy makes sense at all. If the scale is chosen incorrectly, ordinary noise can stop you out even when the trading idea is right.
The same stop can be reasonable on BTC and far too tight on a volatile altcoin. That is not bad luck: the market simply breathes wider than you allow it to.
What you will take from this guide:
- How to measure:
ATR (average range),σ (dispersion of returns), Bollinger Bands (compression/expansion),IV (option market expectations). - How to read the regime: when the market compresses before a move, when it expands and why chop creates many false pushes.
- How to apply it: volatility-based stops, position sizing from risk, partial exits and trailing logic.
Goal: before entering a trade, you should be able to answer three questions:
Volatility in simple words: the width and speed of price movement
What volatility is and why it sets the scale for stops, position size and realistic movement expectations.
The key nuance: volatility does not answer the question “where will price go?” It answers “how far can price move and how quickly?”. That is why volatility is first about risk and scale, and only then about finding entries.
Mini-example: if an asset usually moves about 1% within an hour, a 0.2% stop will often sit inside normal noise. You may be right on direction and still lose because the entry math is wrong.
- What is the typical range on my timeframe, so the stop is not inside noise?
- Which stop is logical by structure and volatility, not by a pretty round number?
- What position size fits my risk when the stop has that distance?
Why crypto is so volatile and how it changes your tactics
Causes of volatility → common trade failures → practical actions to avoid stop-outs and slippage.
Market structure
- Thin liquidity: the same order size moves price more, and slippage grows.
- Fragmented venues: prices align with delay, which creates sudden pushes.
- Derivatives: liquidation cascades accelerate impulses and reversals.
- 24/7 trading: sharp moves can happen during low-liquidity hours.
Participant behavior
- Events and narratives: listings, hacks, upgrades and regulation quickly change demand and supply.
- The crowd: FOMO and panic are especially strong in altcoins.
- Ownership concentration: a large holder can move a thin order book abruptly.
- Capital rotation: volatility travels between sectors together with money flows.
| Market signal | What it means for the trade | How to adapt |
|---|---|---|
| Ranges narrow, ATR falls | False breakouts become more likely | Wait for confirmation; do not enter inside the squeeze |
| Ranges expand, candles get longer | Stop-out and slippage risk rises | Reduce risk/leverage; avoid entering at the candle extreme; scale in |
| Lots of chop and false pushes | Trend entries worsen and overtrading increases | Trade less; work from range boundaries; tighten filters |
| Spread widens, order book thins | Actual risk exceeds calculated risk | Reduce size more than the formula suggests; avoid thin pairs |
In 2023–2024 the crypto market repeatedly switched between compression and sharp impulse phases: on BTC/ETH this looked like a change in tempo, while on altcoins it often produced spikes and harsher stop-outs. In practice it is better to keep three scenarios ready: range, breakout after compression and high-volatility mode.
Volatility in percentages: how to read the expected move
σ and IV set the frame: what price dispersion over your horizon the market treats as normal, and where stop or target becomes unrealistic.
Annualized volatility and the √T rule
Volatility is often annualized. For shorter horizons traders use the
Intuition: if daily volatility is about 2%, the “typical” weekly dispersion is not 10%, but around 2%×√7 ≈ 5.3%. It is rough, but it keeps expectations realistic.
How to use the expected move
- Target too far: if the take-profit is far above the typical move for your horizon, you will often interfere and break the plan.
- Stop too tight: if the stop is far below the typical move, normal noise can stop you out even when the idea is correct.
How to measure volatility: metrics that actually help
Here are five volatility metrics and a simple order of work: how to turn them into a stop, risk and position size.
Terms: Range = High–Low. ATR = average true range. σ = volatility in % (standard deviation). IV = option market expectations.
| Metric | What it shows | Practice: what the trader does |
|---|---|---|
| Range high–low |
The movement width for a period | If the stop is smaller than typical range, stop-outs will be frequent |
| ATR true range |
Average range including gaps | Use ATR for stops/trailing; keep entry and stop on the same timeframe |
| Standard deviation σ of returns |
How scattered returns are around the average | Useful for expected move, volatility filters and comparing assets |
| Bollinger width | Compression or expansion of the current range | Helps notice squeeze phases and avoid buying the last candle of an expansion |
| Implied volatility IV |
What options price in for future movement | Useful around events: if IV is elevated, the market already expects a storm |
Simple workflow: define timeframe → check typical range/ATR → place stop outside noise → calculate size from acceptable loss → decide whether the potential target justifies the risk.
Volatility regimes: compression, expansion, trend and chop
Volatility is not constant. A good trader adapts the method to the current regime instead of forcing one setup everywhere.
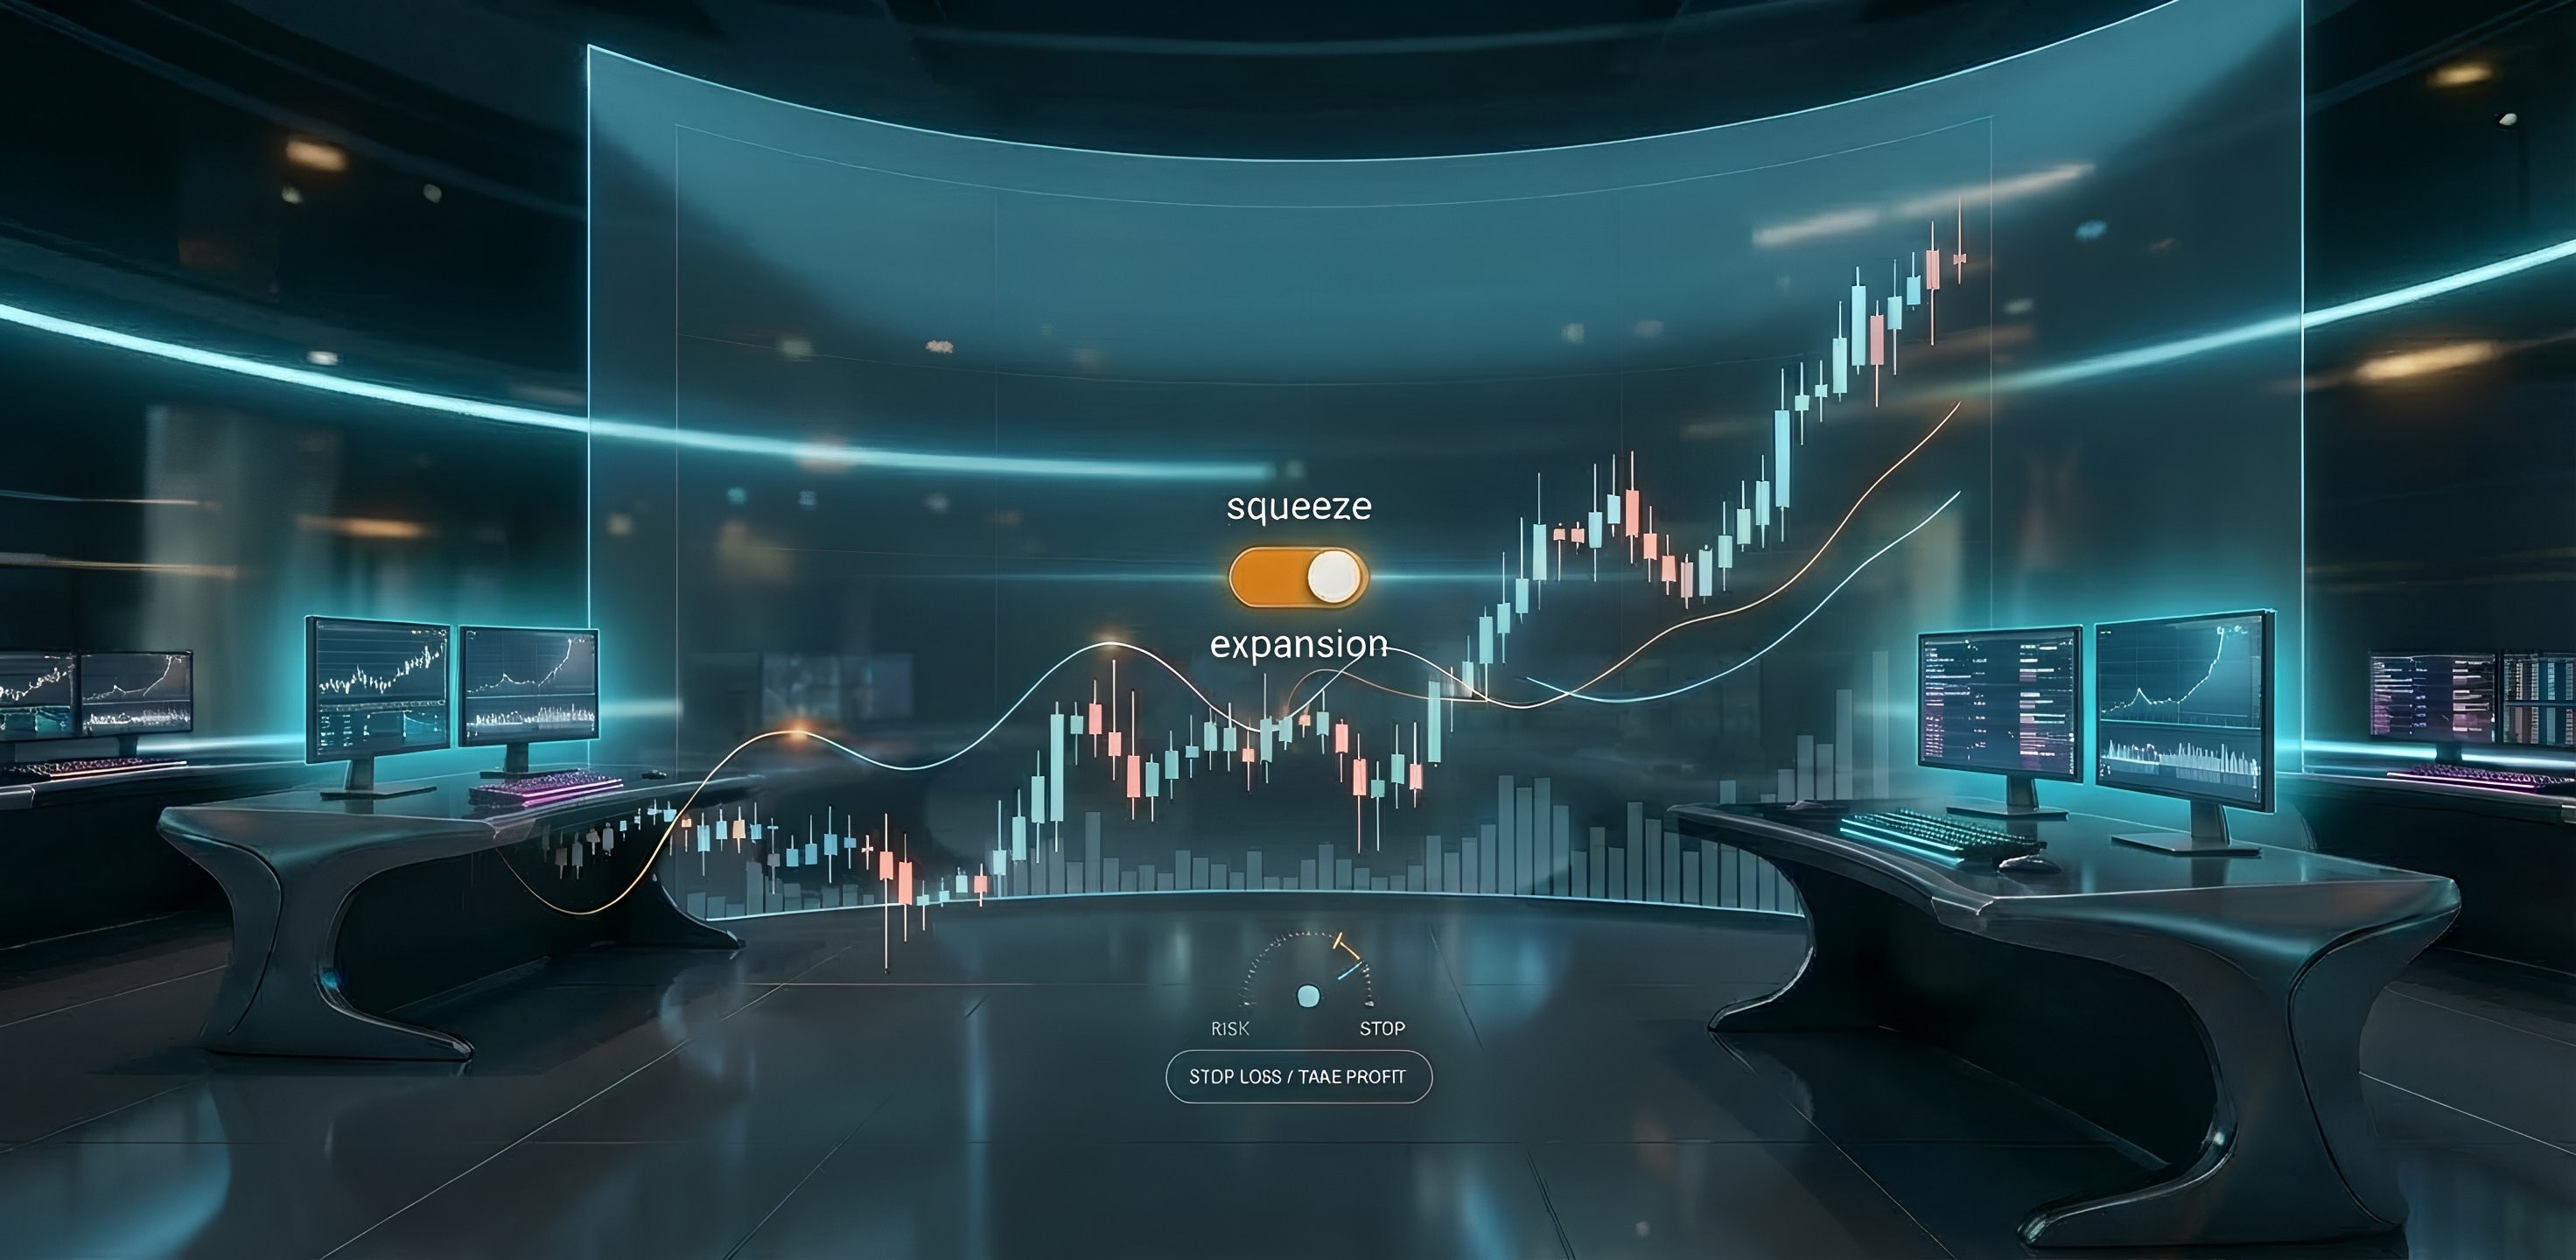
- Compression: ranges narrow, volume often falls, the market stores energy. Breakout traders wait; mean-reversion traders work cautiously near boundaries.
- Expansion: candles lengthen, ATR rises and stops must be wider. The trade may be good, but size should usually be smaller.
- Trend with controlled volatility: pullbacks are readable, trailing makes sense and partial exits protect profit.
- Chop: price whipsaws around the level, breaks fail and overtrading becomes the main enemy.
A practical volatility map should answer two questions: is movement expanding or compressing, and is liquidity sufficient to execute the trade without large slippage? If the answer to the second question is no, the strategy may look good on the chart and still fail in execution.
Volatility and liquidity: why one is dangerous without the other
High volatility can be tradable when liquidity is deep. High volatility in a thin market is often just a trap for poor execution.
Volatility describes how much price moves; liquidity describes how much volume the market can absorb. These two variables must be read together. A liquid BTC move and a thin altcoin spike can both show a 4% candle, but the execution risk is completely different.
| Situation | Main risk | Practical response |
|---|---|---|
| High volatility + deep book | Fast movement, but execution is usually possible | Reduce size, use planned entries, avoid market panic |
| High volatility + thin book | Slippage, stop gaps, fake prints | Trade smaller or skip; prefer limit orders and more liquid pairs |
| Low volatility + thin book | Sudden one-sided moves after a large order | Do not assume quiet equals safe |
Volatility and risk management: stop, position size, leverage
The stop is not chosen first. First you read volatility, then place the stop, then calculate position size.
The simplest risk formula is still the most useful: position size = allowed loss / stop distance. If the stop must be twice as wide because volatility is higher, the position should be about twice as small. Keeping the old size while widening the stop is hidden leverage.
Example: you risk $100. With a 1% stop, the position can be roughly $10,000. If current volatility requires a 3% stop, the same $100 risk allows only about $3,333.
- Stop beyond noise: place it where the setup is invalid, not where the loss feels comfortable.
- Size from loss: decide how much you can lose first, then calculate the position.
- Leverage after volatility: leverage is only acceptable if liquidation is far outside normal movement.
- Reduce around events: news, unlocks, listings and macro releases can instantly change the regime.
Entries and exits through volatility: where a trader gets an edge
Volatility is not only a risk filter. It also helps decide when a move has room and when the easy part is already gone.
In compression, the edge is patience: wait for a real breakout, retest or volume confirmation. In expansion, the edge is discipline: avoid chasing the vertical candle, reduce size and let the setup come to you. In chop, the edge is selectivity: many trades look tempting, but the market is paying less for aggression.
- Before entry: compare current range with normal range. If movement is already stretched, do not pay the worst price.
- After entry: manage the stop according to structure and ATR, not according to fear.
- At exit: take partial profit when the move reaches a statistically meaningful range, then trail the rest if trend continues.
Three playbooks: how to trade volatility in different conditions
One setup cannot cover every market. Below are three practical playbooks for different volatility regimes.
Compression → breakout: catching volatility expansion
- Signal: narrowing range, falling ATR/Bollinger width, price sitting near a clear boundary.
- Entry: breakout plus confirmation, or retest after the first impulse.
- Risk: false breakout and quick return into the range.
- Management: smaller initial size, stop beyond the range, partial profit on the first expansion.
Range and mean reversion: earning from repetition
- Signal: repeated rejection from the same boundaries, no follow-through after breakouts.
- Entry: near edges, after failed continuation, with clear invalidation outside the range.
- Risk: the range finally breaks and the old mean-reversion logic stops working.
- Management: take profit faster, avoid adding into the middle, stop trading the range after clean expansion.
News impulse: handling a volatility spike carefully
- Signal: sudden candle, volume spike, spreads widening, social/media trigger.
- Entry: only after the first chaos settles, preferably on pullback or confirmed continuation.
- Risk: huge slippage, emotional chase, liquidation cascade in the opposite direction.
- Management: reduce leverage, use limit logic where possible, accept that skipping is also a decision.
Workflow and journal: how to build volatility into your system
A volatility-aware trader records not only entry and exit, but also the market regime in which the decision was made.
Add a few fields to your trading journal: current ATR or range, liquidity state, spread, event risk, regime label and whether the trade followed the plan. Over time this shows where your strategy actually works. Many traders discover that their losses cluster in one regime: late-stage expansion, low-liquidity hours or choppy ranges.
| Journal field | Why it matters |
|---|---|
| Volatility regime | Shows whether the setup works in compression, expansion, trend or chop |
| ATR/range at entry | Helps compare stop size with normal movement |
| Liquidity/spread | Explains why theoretical risk differed from actual execution |
| Event context | Separates planned trades from news-driven reactions |
| Rule violation | Highlights emotional decisions during high-volatility phases |
Volatility targeting: how to change risk size by regime
Volatility targeting means reducing risk when the market becomes more unstable and increasing it only when conditions justify that.
The idea is simple: if an instrument becomes twice as volatile, the same nominal position carries roughly twice the movement risk. A fixed dollar position therefore creates inconsistent risk. Volatility targeting keeps risk closer to constant by adjusting size to the current regime.
Practical version: choose a normal risk unit. If ATR is near its usual level, trade standard size. If ATR is 1.5–2 times higher, reduce size. If volatility is compressed, do not automatically increase size; wait for confirmation because breakouts can fail.
Relative volatility: how to choose coins and avoid hidden leverage
Comparing coins by volatility helps choose the right instrument for the strategy and avoid taking more risk than intended.
A 3% daily move can be routine for one altcoin and extreme for another. That is why relative volatility matters: you compare the coin not only with BTC/ETH, but also with its own history and with the sector it belongs to.
- Large caps: usually lower volatility and better execution, but fewer explosive moves.
- Mid caps: often offer a balance of movement and tradability.
- Small caps: can move sharply, but liquidity and slippage dominate the risk.
- Meme coins: volatility is often narrative-driven and may change regime within hours.
Psychology and volatility: why the plan breaks in the storm
Volatility amplifies emotion. The faster price moves, the more tempting it becomes to abandon the plan.
High volatility creates two opposite traps. During a rally, FOMO pushes traders to enter late, widen risk and ignore invalidation. During a drop, fear pushes them to close early, move stops or reverse without a plan. Both reactions are psychological, but they are triggered by market speed.
- Predefine risk: decide loss size before the candle starts moving.
- Use orders, not impulses: plan entries and exits while calm.
- Reduce frequency: in a storm, fewer trades often means better decisions.
- Review screenshots: they show whether the trade was planned or emotional.
Mistakes and checklist: how to tune a trade to volatility
Before entering, run through the checklist. It catches the most common volatility mistakes before they become losses.
⚠️ Common mistakes
- Using the same stop on BTC and on a thin altcoin.
- Increasing leverage because the chart “looks quiet”.
- Entering after the expansion candle without a pullback or plan.
- Ignoring spread and order-book depth.
- Moving the stop when volatility does what was expected.
✅ Pre-trade checklist
- What is the current volatility regime?
- Is the stop outside normal noise and still acceptable?
- Does the position size match the stop distance?
- Is liquidity deep enough for the planned size?
- What is the exit plan if movement expands quickly?
Quick answers: volatility inside a trade
Is high volatility always bad for trading?
No. High volatility can create opportunity, but only if liquidity, stop distance and position size are adjusted. The problem is not volatility itself, but using normal-day risk in abnormal conditions.
Which volatility metric is best for beginners?
ATR is usually the easiest starting point. It translates volatility into a practical price range and helps place stops outside normal noise.
Can volatility predict direction?
Not by itself. Volatility shows the expected width and speed of movement, not the direction. Direction still requires structure, trend, flow or another setup logic.
Why do I get stopped out and then price goes my way?
Often the stop sits inside the instrument’s normal range. The idea may be directionally correct, but the stop is too tight for current volatility.
Should I trade smaller when volatility rises?
In most cases yes. If the stop must be wider, position size should decrease so the money risk stays stable.
Final thoughts: turning volatility into practice
Volatility becomes useful only when it changes your concrete decisions: stop, size, entry, exit and whether to trade at all.
Crypto volatility is not an enemy. It is the market’s operating environment. The same setup can be excellent in one regime and untradable in another. A volatility-aware trader does not ask only “bullish or bearish?”; they ask whether the expected movement, liquidity and risk budget make the trade worth taking.
Main idea: do not fight volatility with hope. Measure it, size for it and build exits around it.
- Before the trade: identify regime, typical range and liquidity.
- During the trade: manage stop and partial exits according to plan, not emotion.
- After the trade: record whether volatility helped, hurt or invalidated the setup.
CryptoRanks note: for daily context, compare volatility with current cryptocurrency prices and market data.